

The TSUMAPS-NEAM project ( LINK) developed the first probabilistic tsunami hazard map for the entire NEAM region. An indispensable tool for planning risk mitigation measures. The region called NEAM is defined as part of the division of the world's oceans by the Intergovernmental Oceanographic Commission and includes the North-East Atlantic Ocean, the Mediterranean Sea and the connected seas.
Tsunamis can be generated by earthquakes, underwater landslides, volcanic eruptions, extreme weather conditions and even meteor impacts. TSUMAPS-NEAM addresses the tsunamis generated by earthquakes, which are the most frequent and have the greatest potential for destruction.
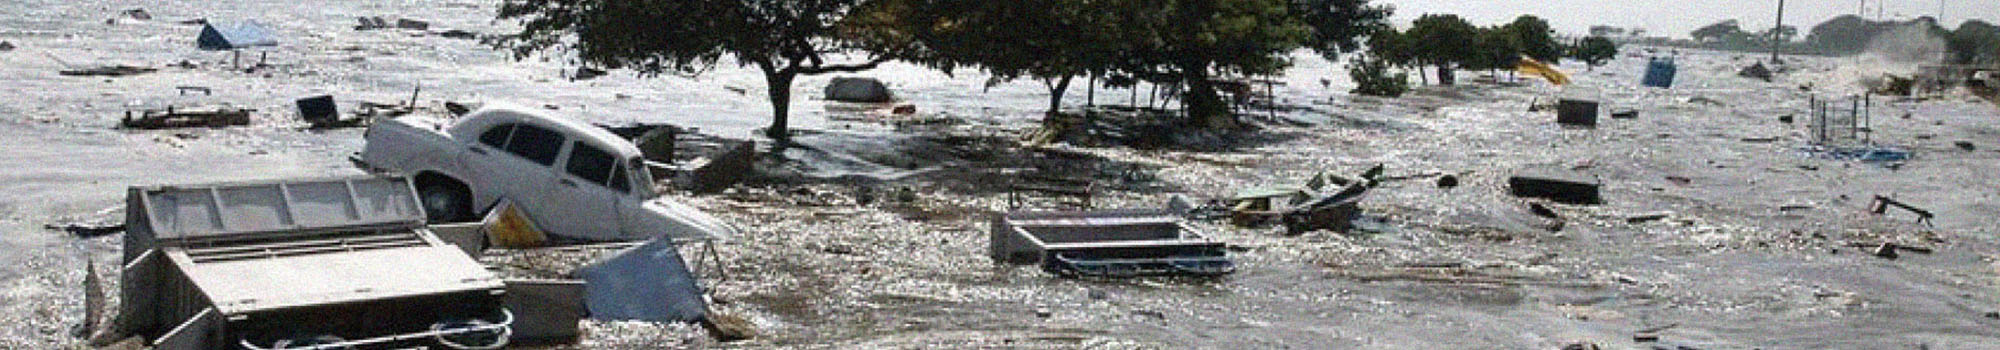
Although tsunamis are rare events, they can cause immense destruction. In the NEAM area there are historical records of the occurrence of tsunamis, even very ancient ones. An example is the tsunami following the earthquake of 365 AD generated in Crete, which produced destruction at various locations in the eastern Mediterranean. On the side of the Atlantic Ocean the earthquake followed by a tsunami that destroyed Lisbon in 1755 is well known. In Italy we remember one of the most destructive events ever, the earthquake of Messina and Reggio Calabria in 1908, followed by a tsunami.
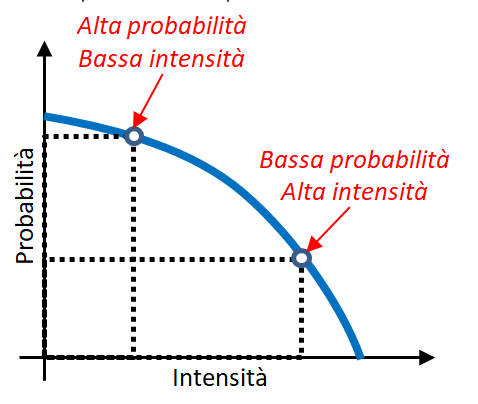 |
| Una curva di pericolosità: all'aumentare della probabilità diminuisce l'intensità del fenomeno, e viceversa. |
For a complete list of tsunamis see the Euro-Mediterranean Tsunami Catalogue . In more recent times the tsunami of 2003 generated in Boumerdes, Algeria, and of 2017, generated on the border between Greece and Turkey, near Bodrum and Kos and, more recently, the event in Zakynthos in October of 2018. Although these were relatively "small" tsunamis, these events remind us of the existence of this danger and the need to be prepared to face it and prevent its effects.
But how can we estimate and describe the danger of tsunamis?
To answer this question, we first calculate the so-called hazard curves.
A hazard curve is the graphical representation of the result of a mathematical calculation. The curve represents the probability that a certain level of intensity of a phenomenon can be exceeded in a given time period, called "exposure time". The probability and frequency of occurrence of an event over time are linked to each other so that each probability value corresponds to an average return period, or the average time that elapses between two consecutive events of the same intensity. The probability is a number between 0 and 1 and is often expressed as a percentage (from 0 to 100).
The danger can be represented in a geographical map showing the points of interest, coloured differently according to the level of danger derived from the aforementioned curves. To do this there are two alternative but equally effective methods in relation to the type of use that must be made of them.
 |
|
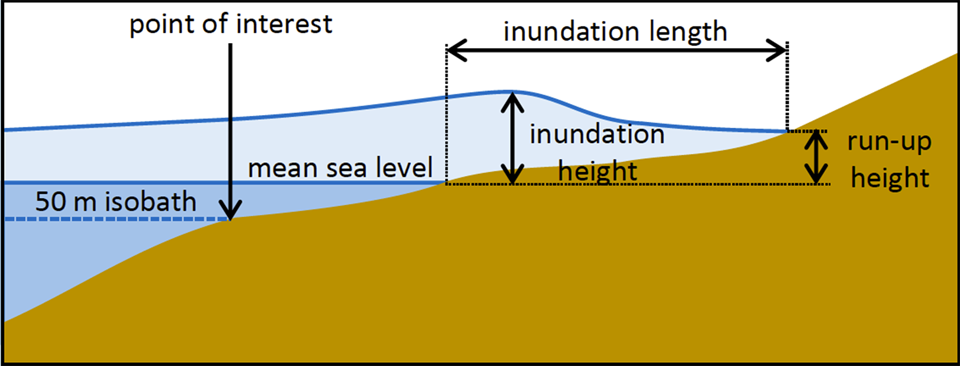
Le grandezze che vengono misurate per definire l'intensità degli tsunami |
The first method consists in choosing a certain level of probability (or average return time) from the vertical axis and obtaining from the curve the value of the corresponding intensity on the horizontal axis. This is how the hazard maps, as they are properly called, are developed, mainly for use in engineering applications.
The second method consists in choosing an intensity level from the horizontal axis and in deriving from the curve the corresponding probability on the vertical axis. This is how probability maps are created that are most useful for communicating the danger to the public.
The intensity value of the phenomenon can be measured differently depending on the phenomenon analysed and the use of the map to be developed.
In TSUMAPS-NEAM data from different European projects and their original elaborations were used for the calculation of the hazard curves. These data concern geological information, earthquake catalogues, active faults and subduction zones, as well as information on the rate of deformation of the earth's crust.
On the basis of these data, millions of tsunami numerical simulations have been performed, each of which has been given a probability of occurrence.
The intensity of the tsunami is measured as "maximum inundation height" (MIH) which indicates the maximum height of the water column above the surface of the ground when the wave invades the land.
In the hazard and probability maps developed, over 2000 points of interest are represented, spaced on average 20 kilometres from one another, so as to cover as uniformly as possible all the coastlines of the NEAM region; of these, 1076 points are located in the north-east Atlantic Ocean, 1130 points in the Mediterranean Sea and 137 points in the Black Sea.
Considering the spacing of the points of interest, this measure necessarily represents an average value of all the maximum heights that the water can reach in the area behind the point of interest. This means that locally the maximum height can even reach values higher than those estimated by the hazard model.

The hazard and probability maps are freely accessible and can be consulted on the project website through an interactive visualization tool . As it is an international project, the website is entirely in English.
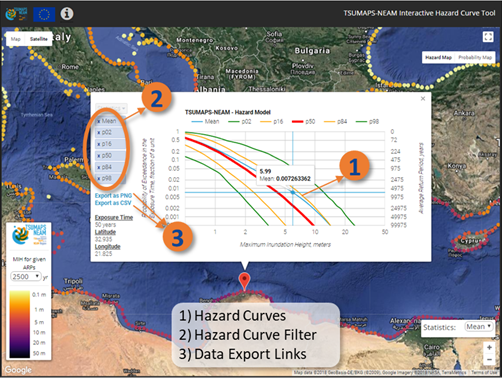 Esempi di consultazione delle mappe di pericolosità da tsunami realizzate dal progetto TSUMAPS-NEAM. Nell’inquadratura in alto è rappresentata l’intera regione NEAM. Nell’inquadratura in basso si vede un esempio di consultazione di un grafico di pericolosità, in cui le varie curve rappresentano la variabilità del modello di pericolosità nel punto selezionato. In entrambe le viste sono evidenziati gli strumenti che l’utente può utilizzare per modificare le caratteristiche della vista stessa, o per scaricare i dati sul proprio computer.Al progetto TSUMAPS-NEAM, oltre all’Istituto Nazionale di Geofisica e Vulcanologia (INGV) che lo ha coordinato, hanno partecipato i seguenti enti di ricerca, con sede in diversi paesi dell’area NEAM
The user can choose to view 30 different maps one by one, each of which represents a different average return period, or a different maximum flood height, or a different level of uncertainty related to these values.
Just click anywhere on the map to see the hazard curve graph at that point.
The TSUMAPS-NEAM project, in addition to the National Institute of Geophysics and Volcanology (INGV) that coordinated it, was attended by the following research institutions, based in different countries of the NEAM area:
- Norges Geotekniske Institutt (NGI), Norway
- Instituto Português do Mar and by Atmosfera (IPMA), Portugal
- Helmholtz-Zentrum Potsdam Deutsches GeoForschungsZentrum (GFZ), Germany
- Middle East Technical University (METU), Turkey
- Universitat de Barcelona (UB), Spain
- National Observatory of Athens (NOA), Greece
- Center National pour la Recherche Scientifique et Technique (CNRST), Morocco
- Institut National de la Météorologie (INM), Tunisia
The TSUMAPS-NEAM project lasted 21 months, from January 2016 to September 2017, and was funded by the Department for Humanitarian Aid and Civil Protection of the European Union.